Performance
ICP is designed to run applications at web speed. This page explains the key performance metrics, how the protocol architecture determines them, and the figures measured on mainnet and in synthetic experiments.
Performance numbers are point-in-time snapshots. Engineers maintaining this page should refresh mainnet figures using the IC Dashboard APIs: the daily_stats endpoint for throughput and the metrics endpoint (instruction-rate) for MIEPS. Live network statistics are always available on the IC dashboard.
Metrics
Section titled “Metrics”Three metrics characterize ICP performance.
MIEPS (Millions of Instructions Executed Per Second) measures raw compute throughput: how many Wasm instructions the network executes per second across all subnets, counting only replicated (update) execution. It is the primary indicator of useful work done by the protocol. A single subnet can execute up to 8 billion instructions per second; with 42 subnets, the theoretical network capacity is approximately 336,000 MIEPS.
Throughput measures how many messages the network processes per second. It is reported separately for update calls (replicated, state-changing) and query calls (non-replicated, read-only), because the two execution modes have fundamentally different scalability properties.
Latency is the time between submitting a call and receiving a response. For update calls this includes the consensus round; for query calls it is dominated by network round-trip time to a single node.
Update calls vs query calls
Section titled “Update calls vs query calls”The most important architectural performance distinction is between the two call types:
Update calls go through consensus. Every node in the subnet executes the call, and the response is certified by the subnet’s threshold signature. This guarantees correctness but means latency is bounded by consensus finality: roughly one to two seconds under normal conditions, longer on larger subnets. Update throughput is limited by the subnet’s consensus capacity and scales by adding more subnets, not more nodes per subnet.
Query calls bypass consensus. A single node executes the query and returns a result immediately. Latency is dominated by network round-trip time: typically 100–200ms. Because every node can serve queries concurrently and independently, query throughput scales linearly with subnet size. The tradeoff is trust: a single node produces the response, so query results are not subnet-certified unless the canister uses certified variables.
Mainnet measurements
Section titled “Mainnet measurements”The following figures were last measured on July 1, 2025. Each value links to the API call that produced it.
| Metric | Value | Notes |
|---|---|---|
| MIEPS (average) | 64,625 | Replicated execution only; query calls excluded |
| MIEPS (all-time peak) | 249,524 | Recorded January 16, 2025 |
| Update call throughput (daily average) | 1,076/s | |
| Query call throughput (daily average) | 4,023/s | |
| Update call throughput (all-time peak, 1 min) | 25,621/s | |
| Query call throughput (all-time peak, 1 min) | 19,598/s | Recorded July 9, 2024 |
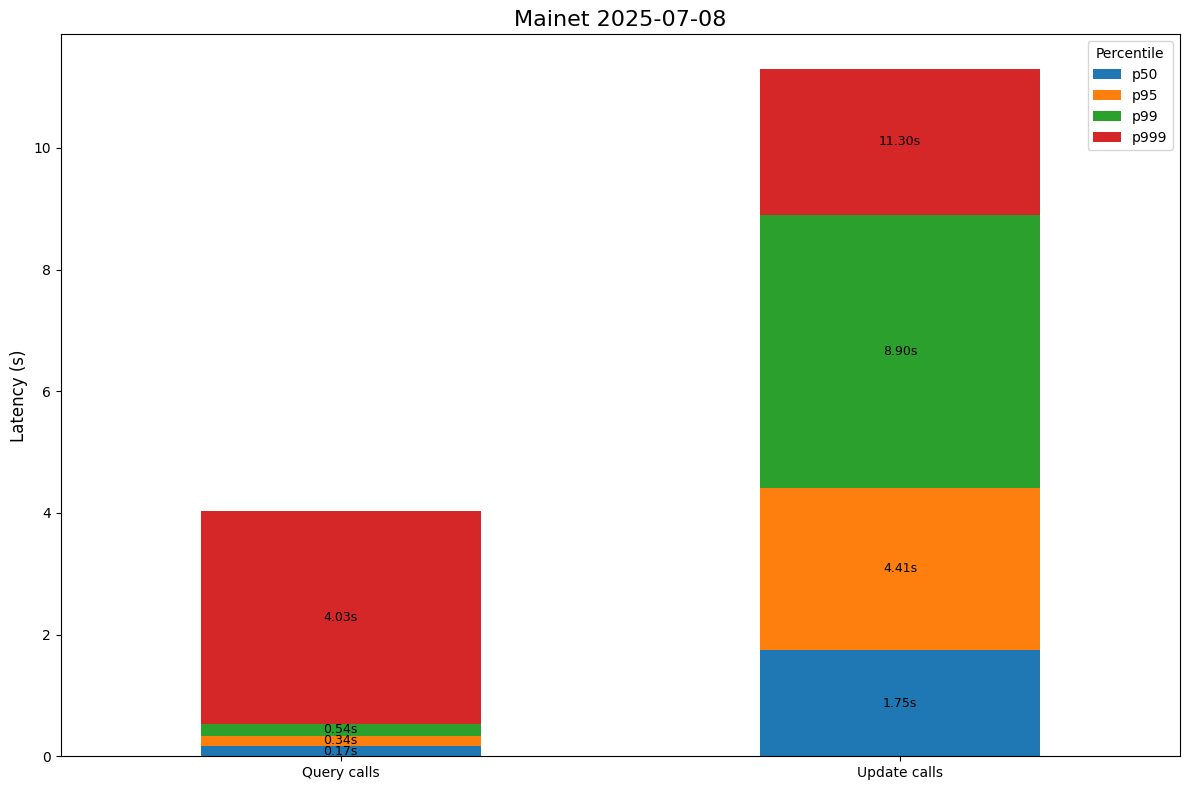
| Update call latency (median, via HTTP gateway) | 1.75s | |
| Query call latency (median, via HTTP gateway) | 0.167s |
The chart below shows the latency distribution observed at HTTP gateways:
Latency varies by subnet size because consensus requires agreement among more nodes on larger subnets:
| Call type | Subnet | Median latency |
|---|---|---|
| Update (counter canister) | Application subnet (13 nodes) | 1.35s |
| Update (ICP ledger transfer) | NNS subnet (40 nodes) | 2.23s |
Synthetic benchmarks
Section titled “Synthetic benchmarks”Controlled experiments isolate execution performance from real-world network variability. These experiments use the counter canister (a minimal canister that increments a counter on every message) to measure raw protocol throughput without application overhead. The test subnet had 13 nodes, all in the same data center, with simulated 30ms RTT between nodes.
Throughput
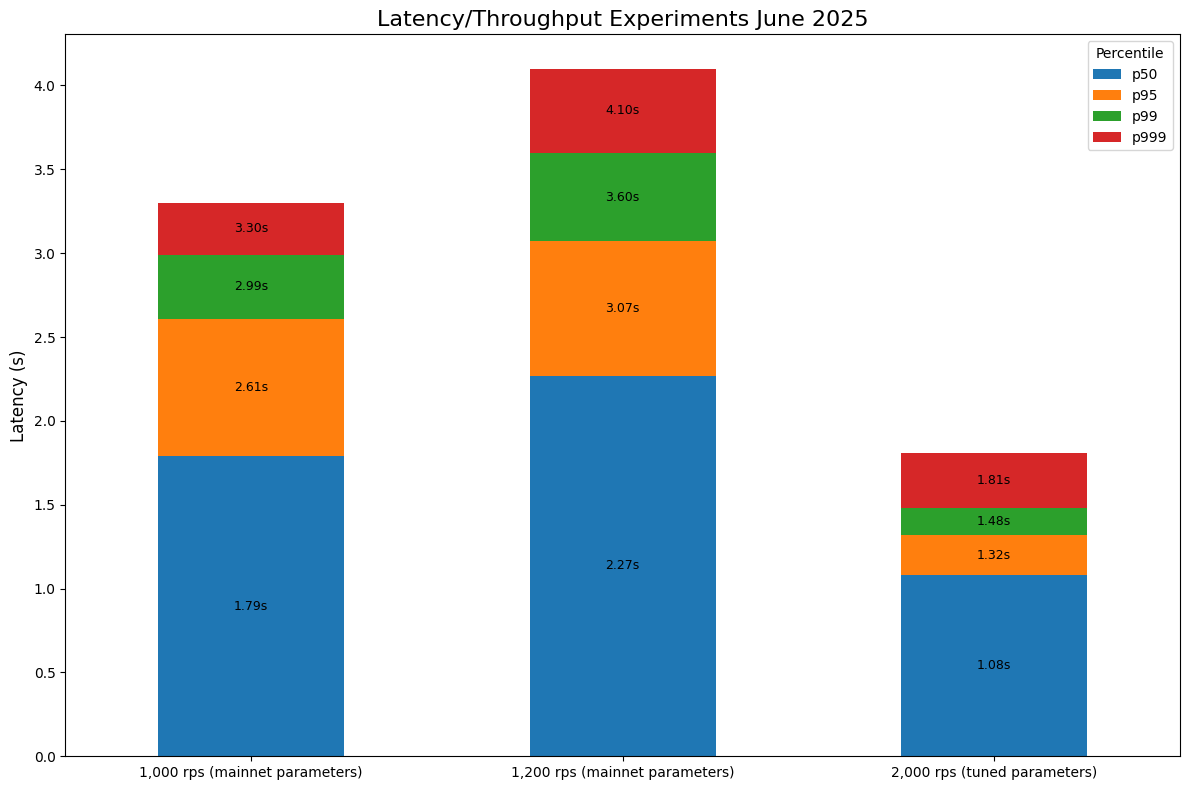
Section titled “Throughput”Results from experiments run in June 2025:
| Scenario | Throughput | Notes |
|---|---|---|
| Update calls, mainnet parameters | 1,200/s (sustained) | Single 13-node test subnet |
| Update calls, tuned parameters | 2,000/s (sustained) | Reduced notary delay, optimized certification timer |
| Update calls (network-wide extrapolation) | 84,000/s | 42 subnets × 2,000/s |
| Query calls per node | 7,025/s | November 2023 experiment |
| Query calls (network-wide extrapolation) | 4,467,900/s | 636 nodes × 7,025/s |
Tuned parameters include the notary delay, certification timer interval, the hashes-in-blocks optimization, and the in-memory response cache size. Mainnet uses conservative parameters to prioritize stability.
Throughput is also measured in data volume: a single subnet can sustain approximately 7 MB/s. See Stellarator part 3 for the detailed analysis.
Latency under load
Section titled “Latency under load”Latency depends on load and parameter tuning. At throughput saturation, mainnet parameters produce higher latency than tuned parameters; under low load the difference is larger:
| Parameters | Load | Median latency |
|---|---|---|
| Mainnet (conservative) | 1,200/s (saturation) | 2.27s |
| Tuned | 2,000/s (saturation) | 1.08s |
| Tuned | 1/s (low load) | 0.52s |
The chart below shows how latency varies across the full throughput range for both parameter sets (June 2025):
The lower synthetic latencies compared to mainnet reflect the controlled setup: all 13 nodes in one data center with simulated 30ms RTT. On mainnet, inter-node RTT averages 125ms across the full network, which adds to consensus latency.
Node network latency
Section titled “Node network latency”ICP nodes communicate over the public IPv6 internet without dedicated links. The table below shows round-trip times in milliseconds between nodes in 12 data centers, measured in September 2023. The figures change slowly as network infrastructure matures and remain representative of the inter-regional pattern.
| Brussels | Chicago | Dallas | Fremont | Geneva | Ljubljana | Munich | Orlando | Singapore | Stockholm | Tokyo | Zurich | |
|---|---|---|---|---|---|---|---|---|---|---|---|---|
| Brussels | 102 | 121 | 143 | 17.65 | 27.4 | 18.35 | 106 | 167 | 36.6 | 223 | 16.07 | |
| Chicago | 102 | 24.6 | 59.05 | 118 | 130 | 110 | 49.4 | 249.5 | 117.5 | 152 | 121.5 | |
| Dallas | 121 | 24.6 | 53.8 | 132 | 137 | 127 | 37.05 | 276 | 131 | 139 | 129.5 | |
| Fremont | 143 | 59.05 | 53.8 | 145 | 156 | 145 | 67.7 | 191 | 161 | 109 | 147 | |
| Geneva | 17.65 | 118 | 132 | 145 | 26.95 | 17.9 | 112 | 257.5 | 38.3 | 248 | 16.05 | |
| Ljubljana | 27.4 | 130 | 137 | 156 | 26.95 | 17.55 | 123 | 258 | 42 | 235 | 22.1 | |
| Munich | 18.35 | 110 | 127 | 145 | 17.9 | 17.55 | 118 | 251 | 37.5 | 246 | 12.35 | |
| Orlando | 106 | 49.4 | 37.05 | 67.7 | 112 | 123 | 118 | 250 | 131 | 166 | 111 | |
| Singapore | 167 | 249.5 | 276 | 191 | 257.5 | 258 | 251 | 250 | 195.5 | 177 | 200.25 | |
| Stockholm | 36.6 | 117.5 | 131 | 161 | 38.3 | 42 | 37.5 | 131 | 195.5 | 260 | 36.9 | |
| Tokyo | 223 | 152 | 139 | 109 | 248 | 235 | 246 | 166 | 177 | 260 | 230 | |
| Zurich | 16.07 | 121.5 | 129.5 | 147 | 16.05 | 22.1 | 12.35 | 111 | 200.25 | 36.9 | 230 |
European nodes communicate at 12–42ms RTT. Intercontinental pairs range from 102ms (Brussels–Chicago) to 276ms (Dallas–Singapore). The overall network median is approximately 125ms.
Network latency is a floor for consensus latency: a consensus round requires multiple message exchanges between all nodes in a subnet. The Tokamak protocol optimizations (blog post) reduced median update call latency significantly by restructuring the consensus message exchange pattern.
Further reading
Section titled “Further reading”- Execution layer: WebAssembly execution, DTS, and cycles accounting
- Consensus: how blocks are proposed, notarized, and finalized
- IC Dashboard APIs: REST APIs for querying live network metrics, throughput, and governance data
- IC dashboard: live network statistics including per-subnet MIEPS and latency
- Usenix ATC 2023 paper: design and performance measurements of the ICP execution layer